Please note that the TSP survey tool has moved to NZCER Assist for 2023.
To ensure the privacy of TSP data, reporting for the TSP principal and teacher surveys can only be viewed by the person who has the TSP survey product owner role. Reports can be accessed by clicking on the reports icon in the TSP survey tool area of NZCER Assist.

Principal and teacher survey reports are viewed separately – this is a change from what was offered previously. To compare responses between the principal and teachers’ responses, we suggest printing the reports out.
Reporting can be viewed in different ways:
- Responses to all aspects of the survey showing in one report (this is the default view).
- Using the filters provided to:
- Sort for specified aspects within sections of the survey.
- Order responses in different ways.
Please note that the teachers’ report will only show if there are 5+ responses. If you are a school with 4 or fewer teaching staff, please click here for some ideas that suggest ways to have open discussions of survey responses.
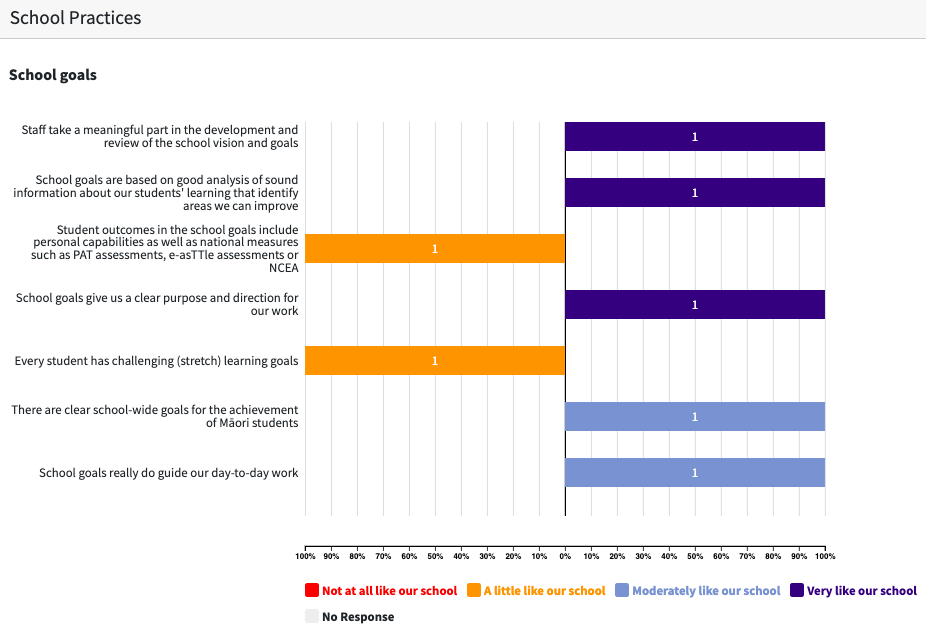
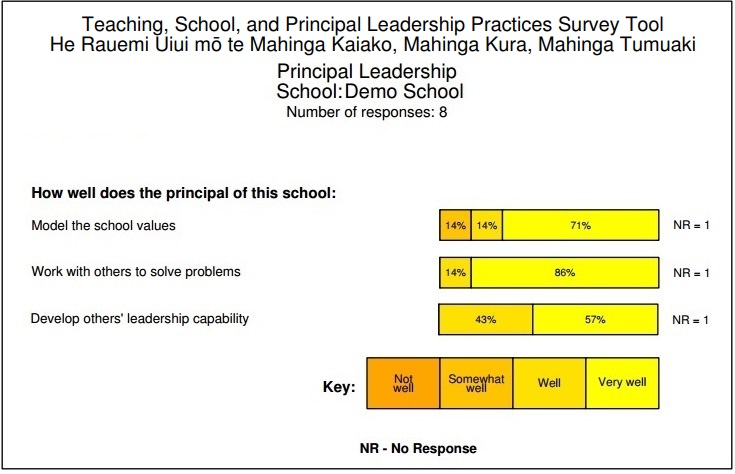
Example of a principal survey report on NZCER Assist
Example of a teacher survey report on NZCER Assist
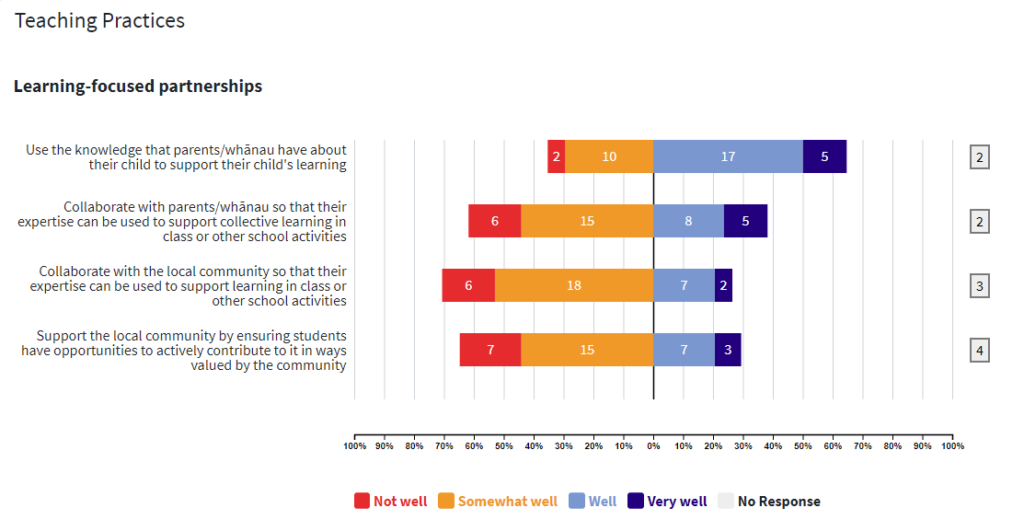
The number of teachers who responded to the item are showing in the different coloured blocks.
The number of non-responses for each question is presented to the right of the bar chart. The number of non-responses can give an indication of how many teachers felt either they did not know the answer or could not decide which answer to pick.
Historic reports (2016-2022)
What the reports look like
On the dashboard the principal or administrator can download these reports:
- Teaching Practices
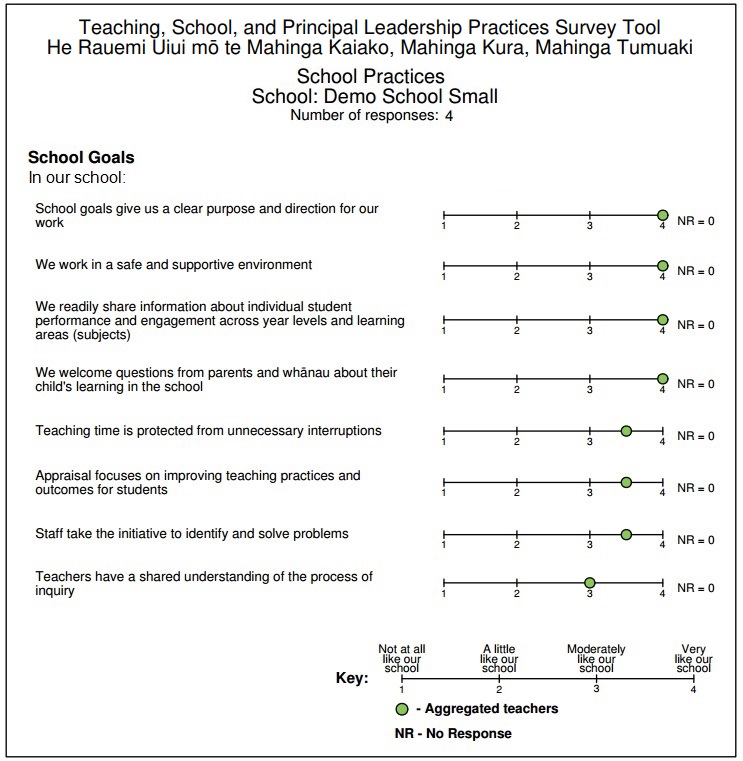
- School Practices
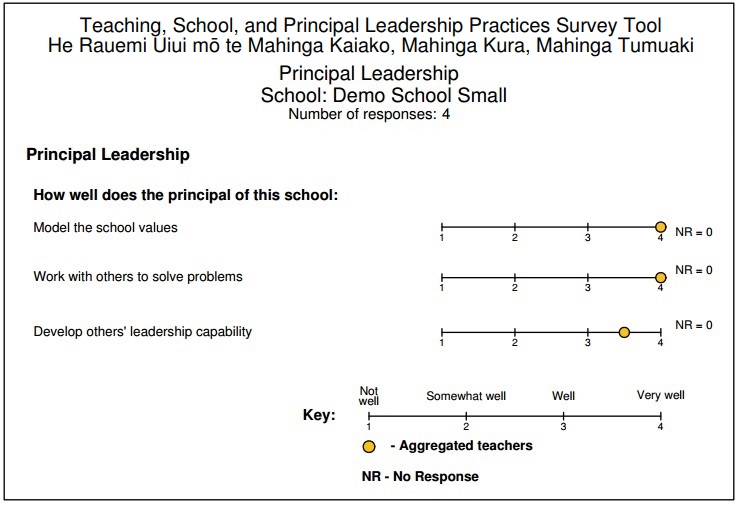
- Principal Leadership
- Teacher workload and morale
The School practices and Principal leadership reports come in two different formats:
- The combined responses from all the teachers
- The combined responses from all the teachers, with the principal’s own response shown separately
The second format can only be accessed by principals. It enables them to see any differences between their own responses and teachers’ responses. This can be a powerful starter for reflection and inquiry. We provide this separately to preserve confidentiality. Principals can choose whether to share this second report format with their staff and others they work with.
If your school has 5 or more teachers responding you’ll get reports that look like this
These bar charts show the proportion of teachers who chose each of the response options, for each of the questions.
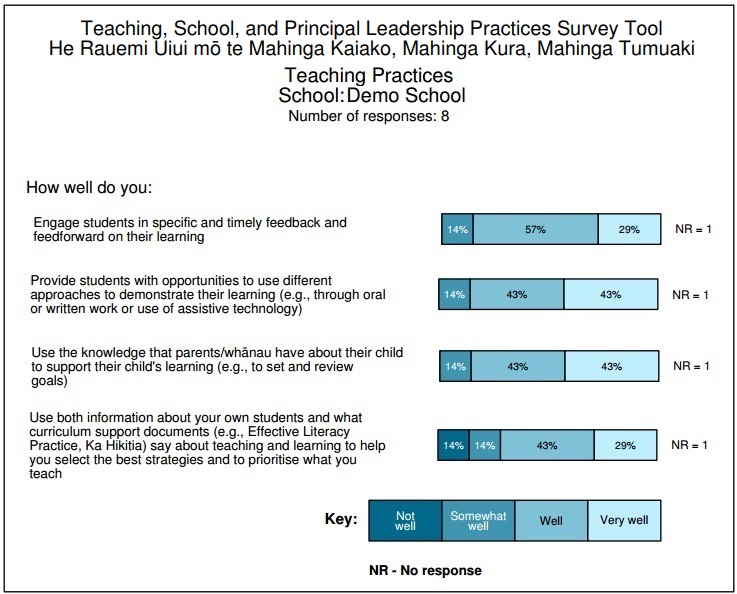
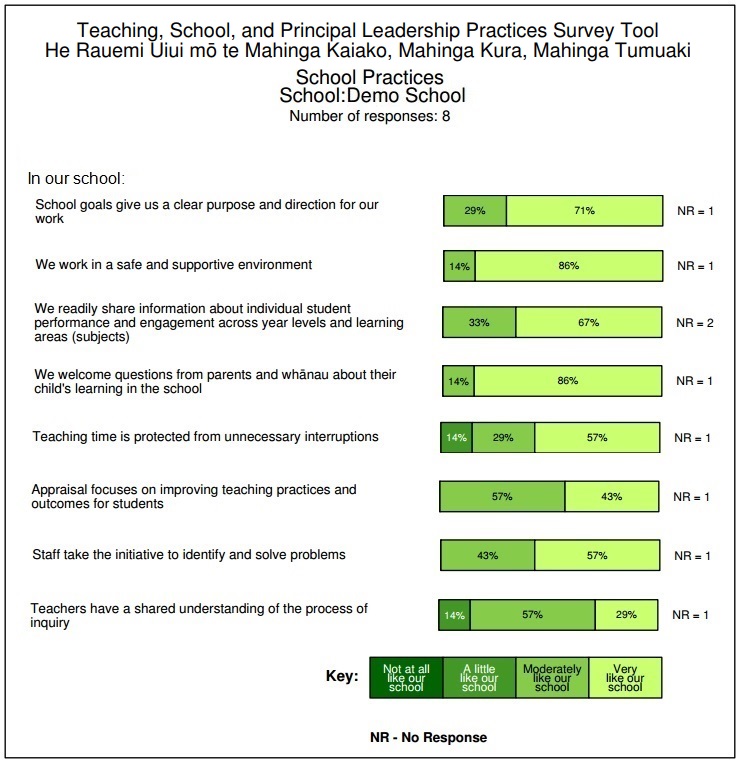
If your school has 3 or 4 teachers responding you’ll get reports that look like this
To preserve confidentiality, reports where there are fewer than 5 teachers give median responses to each of the survey questions.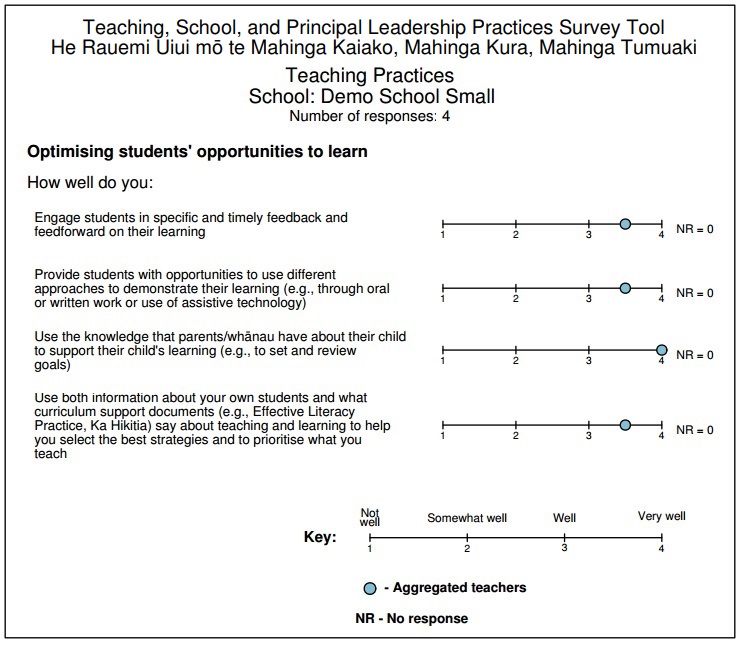
If your school has fewer than 3 teachers responding
We can’t provide you with a report since with small numbers it might be possible to identify individual responses. What some small schools have done is to do the survey, each teacher and the principal prints out their responses, and looked at those together. This approach needs to be voluntary, and is appropriate where principal and teacher(s) have a high degree of trust.
Any questions?
Please contact us at tspsurveys@nzcer.org.nz